
What is PowerPivot?
PowerPivot is an no-charge add-in for Microsoft Excel 2010. PowerPivot brings "self-service business intelligence to your desktop". With the vast volumes of data available to the information professional, having tools to help discover patterns and generate insights is very important to the analyst. Especially important is for these tools to permit the information professional to go in the direction that those insights lead.
The 'PowerPivot for Excel 2010' add-in enables the data analyst to use the familiar worksheets in Excel to import millions of rows of data from multiple data sources. Once in a familiar Excel workbook, the data analyst can use PowerPivot to create relationships between various heterogeneous data. Also, the data analyst can specify and create calculated columns and measures that are more meaningful for the analysis to be conducted. The calculated columns are calculations that the data analyst defines using a PowerPivot formula language called Data Analysis Expressions (DAX). The formulas can combine other metrics or can be functions or perhaps ratios or totals. The functions could include date and time functions, statistical functions, time intelligence functions, math functions, and information functions. The data analyst can gain insight into the volumes of data using these various functions and then gain further insights by building PivotTables and PivotCharts to explore the data.
Where Does the Analyst Get Data?
The data used for analysis can be imported into PowerPivot from many different sources. Organizational databases such as Access, DB2, Informix, Oracle, SQL, Sybase, and/or Teradata can be used as the source. Data can be acquired from various fee or free datasets in the 'Azure Data Marketplace' (Visit https://datamarket.azure.com/browse for more information). Data can be imported from text files, from data feeds, from Analysis Services cubes, and/or from other Excel files. The imported data can be linked data such that as the data is changed in the original source location, it is updated and available for use in the PowerPivot database ensuring that the analyst is using up-to-date information if that is what the analyst wants to do.
The data analyst can then filter and sort the data and can then select only the columns of data that are of interest for the analysis.
Three Key PowerPivot Features
Three key PowerPivot features to investigate are hierarchies, key performance indicators, and perspectives.
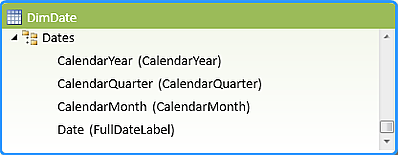
Hierarchies:
Hierarchies can be thought of as a way to bring together the fields of data that the analyst wants to investigate into a simple, natural table structure. Hierarchies are lists of nodes that the analyst can place into any order they want and make it easier to navigate the common paths of data. Hierarchies are simple, intuitive views of the columns of information stored in the table. For example, the analyst create a Calendar hierarchy. In this hierarchy, the Year is used as the top-most node, followed by Quarter, then Month, and then Day (Year → Quarter → Month → Day). This hierarchy shows the analyst a logical relationship from Year to Day.
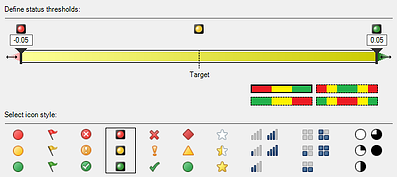
Key Performance Indicators:
A Key Performance Indicator (KPI) is based on a specific measure and is designed to provide insights into the performance of a metric at a glance. KPIs can help the analyst evaluate the status or trend of a key metric or goal.
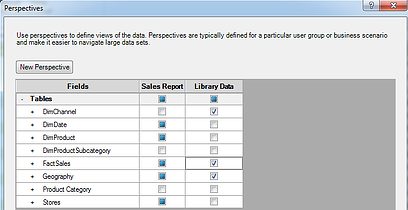
Perspectives:
Perspectives can be used to help users or analysts see the data they are interested in quicker. Perspectives can be thought of as subsets of the data.

References:
- PowerPivot Capabilities: http://technet.microsoft.com/en-us/library/gg399131
- PowerPivot Terms: http://technet.microsoft.com/en-us/library/gg413452
- Data Analysis Expressions (DAX): http://social.technet.microsoft.com/wiki/contents/articles/677.aspx


