Exploring the Correlation between Adult Literacy Rates and Life Expectancy
Overview
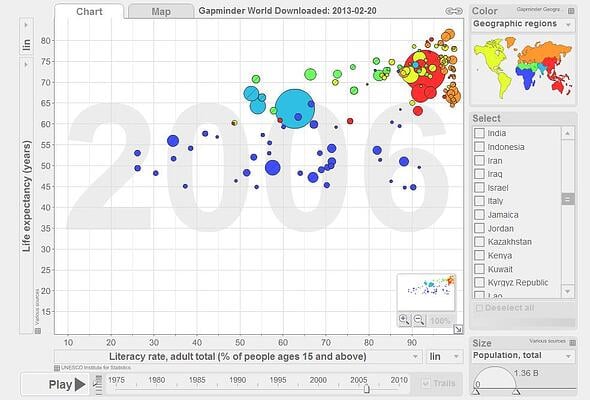
Using Gapminder longitudinal research, I explored the relationship between literacy rates in adults 15 years of age and above, and life expectancy in years. The results were presented in a scatterplot graph, which depicted a positive, nonlinear relationship between the two variables. Generally speaking, the greater the literacy rate, the greater the life expectancy. Most countries followed this pattern, with a few outliers as the exception to the rule. The graph in Figure 1 below was created using the Gapminder software. Literacy rate, adult total (% of people ages 15 and above) is represented on the X-axis, and Life Expectancy (years) is represented on the Y-axis. The size of the plots on the graph is dictated by the countries’ populations. A correlation between the two variables is distinctly visible.