
Analysis of Findings
“Social network analysis is the application of the broader field of network science to the study of human relationships and connections (Hansen, Shneiderman, & Smith, 2011, p. 4).” Networks are “collection[s] of things and their relationships to one another. The 'things' that are connected are called nodes, vertices, entities, and in some contexts, people - refer to Figure 1. The connections between the vertices are called edges, ties, and links - refer to Figure 2 (Hansen, Shneiderman, & Smith, 2011, p. 31).” Social networks are formed “whenever people interact, directly or indirectly, with other people, institutions, and artifacts (Hansen, Shneiderman, & Smith, 2011, p. 31-32).”
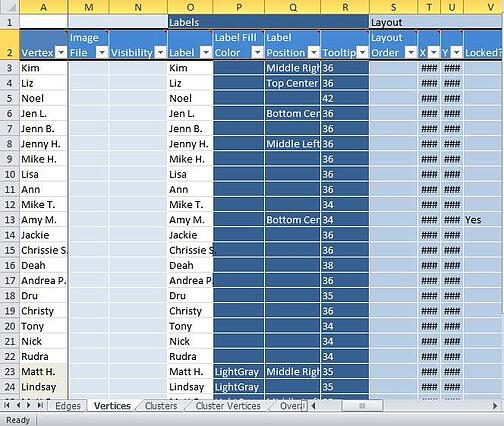
Figure 1: NodeXL Vertices

Figure 2: NodeXL Edges
By conducting a social “network analysis, you can visualize complex sets of relationships as maps (i.e., graphs or sociograms) of connected symbols and calculate precise measures of the size, shape, and density of the network as a whole and the positions of each element within it - refer to Figure 3 (Hansen, Shneiderman, & Smith, 2011, p. 32).” Business people, entrepreneurs, and data analysts “can study enterprise social networks to improve the performance of organizations by identifying key contributors, locating gaps or disconnections across the organization, and discovering important documents and other digital objects (Hansen, Shneiderman, & Smith, 2011, p. 5).”
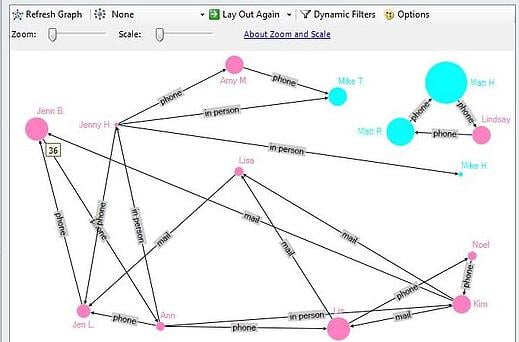
Figure 3: Social Network Graph
There are various types of networks. The network diagramed above is both egocentric and unimodal. Egocentric networks “only include individuals who are connected to a specified ego (Hansen, Shneiderman, & Smith, 2011, p. 36).” Consequently, this particular sociogram represents an egocentric network because it consists solely of people that I know personally. In addition, it is a unimodal network. Unimodal networks “include one type (i.e., mode) of vertex (Hansen, Shneiderman, & Smith, 2011, p.36). In this case, the network connects only people to people, as opposed to connecting documents to people, for example. Thus, it is classified as unimodal rather than multimodal.
In the example above, the size of each individual’s name, or the size of the vertex, is determined by the total number of parties that the individual has attended in the past. From this information, it is possible to deduce that certain individuals, such as Matt H., Matt R., Jenn B., and Liz, have a history of accepting multiple party invitations. This may indicate that these people are more likely to accept a future invitation, based on their past behavior. In addition, as frequent party-goers, it is possible that these four individuals are particularly popular and important to their social networks.
Another feature of network diagrams is that a line, or edge, exists between two people when they have some kind of relationship. In this particular case, an edge exists between two people when one person sends another person a party invitation. Specifically, in this instance, the edge is known as a directed edge. “Directed edges (also known as asymmetric edges) have a clear origin and destination,” and “they are represented on a graph as a line with an arrow pointing from the source vertex to the recipient vertex (Hansen, Shneiderman, & Smith, 2011, p. 34).” “Directed edges may be reciprocated or not (Hansen, Shneiderman, & Smith, 2011, p. 34). These edges can also be classified as unweighted or binary edges because they only indicate “if an edge exists or not (Hansen, Shneiderman, & Smith, 2011, p. 34).”
Various metrics can be used to describe a given social network. Some of these measurements are aggregate network metrics, which describe entire networks, while others are vertex-specific network metrics that identify various “individuals’ positions within a network (Hansen, Shneiderman, & Smith, 2011, p. 40).” Density and centralization are aggregate networks metrics (Hansen, Shneiderman, & Smith, 2011, p. 40).” Density is “used to describe the level of interconnectedness of the vertices, and “is a count of the number of relationships observed to be present in a network divided by the total number of possible relationships that could be present. It is a quantitative way to capture important sociological ideas like cohesion, solidarity, and membership (Hansen, Shneiderman, & Smith, 2011, p. 40).” In the diagram above, there is a high degree of density, as there is a high level of interconnectedness between the people represented.
Another aggregate network metric is centralization. Centralization “characterizes the amount to which the network is centered on one or a few important nodes. Centralized networks have many edges that emanate from a few important vertices, whereas decentralized networks have little variation between the numbers of edges each vertex possesses (Hansen, Shneiderman, & Smith, 2011, p. 40).” In the example above, the network is fairly decentralized, in that multiple relationships emanate from many different people. There are not one or two people that act as hubs, but rather multiple individuals who are connected to many other people.
However, even within this highly connected network, some people are not directly connected. For instance, the group of Matt H., Matt R., and Lindsay are not connected to the other major group of people. Here, there is no person who forms a bridge between the two groups – no broker or connector. Thus, there is a structural hole – “a gap in which there is a missing connector” (Hansen, Shneiderman, & Smith, 2011, p. 39).”
Finally, the diagram above demonstrates a high clustering coefficient. “The clustering coefficient is a measure of the density of a 1.5-degree egocentric network. When these connections are dense, the clustering coefficient is high. If your “friends” (alters) all know each other, you have a high clustering coefficient. If your “friends” (alters) don’t know each other, then you have a low clustering coefficient (Hansen, Shneiderman, & Smith, 2011, p. 41). In this case, most of my friends do know each other, therefore the clustering coefficient is larger.

References
- Hansen, D. L., Shneiderman, B., & Smith, M. A. (2011). Analyzing Social Media Networks with NodeXL: Insights from a Connected World. Burlington, MA: Elsevier Inc. Available at Amazon.com - http://www.amazon.com/Analyzing-Social-Media-Networks-NodeXL/dp/0123822297
- NodeXL: Network Overview, Discovery, and Exploration for Excel. http://nodexl.codeplex.com/
- Social Network Analysis from Wikipedia. http://en.wikipedia.org/wiki/Social_network_analysis
- Social Network Analysis Software from Wikipedia. http://en.wikipedia.org/wiki/Social_network_analysis_software


