
Introduction: Confessions of a Nerd Child
When I was young, my family had an ancient set of Funk & Wagnalls new world encyclopedias. My favorite entries were those about different countries. I loved reading about their histories and cultures, even if the information was outdated. At the beginning of each article was a list of demographics for the country. Checking the variations between countries was one of my many list-based hobbies growing up. I especially liked seeing the similarities and differences between countries that were near to each other, or were similar in size. Population density was a favorite demographic; for some reason I thought it was very interesting how two countries could be roughly the same size, yet have differing amounts of people packed into their borders. Using the Gapminder World program available at www.gapminder.org is like taking those juvenile comparisons and multiplying them out exponentially. With this tool, you have the ability to compare the trends in demographics of many countries over many years, in a two-dimensional space. It is awesome!
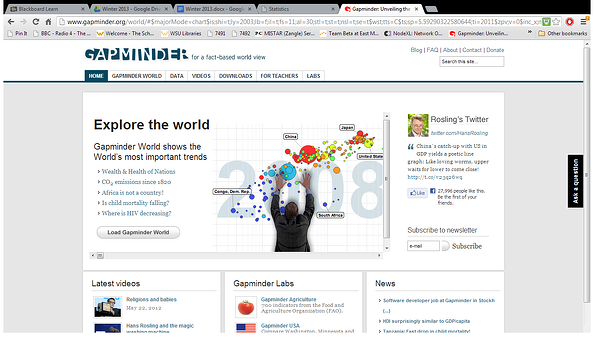
Figure 1: Gapminder.org Home Page
Hans Rosling, creator of Gapminder, states, “statistics tells us whether the things we think and believe are actually true” (The Joy of Stats, 2010). When considering factors that might correlate with Adult Literacy rates, I decided to apply that idea. What did I think was true? What did I expect to see? From a logical standpoint, positive correlations, where literacy increases as x increases, would likely be seen with factors that would allow for children to be educated without interruption, or that are the result of a society that values education. I would expect to see positive correlations between Literacy and Level of Education, Age of First Marriage, Wealth, Access to Health Services, Technological development, Internet connectivity, Multilingualism, number of Universities/Libraries, and urbanization, among others. In the same vein, I would expect to see negative correlations, where literacy increases as x decreases, with factors that would relate to impeding mass childhood education, such as: Number of children, Percent of rural communities, Percent agriculture, Diseases, War, Infant mortality, and average distance to a school. Literacy rates might also be lower in areas that embrace traditional gender roles, because there could be greater emphasis on thoroughly educating boys rather than girls. This potential correlation intrigued me; I believed it to be true, but would the statistics say the same thing? For this reason, I focused on comparing the Literacy rate of adults 15 and older with the Ratio of girls to boys in primary and secondary education, also known as the Gender Parity Index (United Nations, 2012).
Parameters: What Are We Looking
At, Exactly?
For clarity as to exactly what is meant by the chosen parameters, I include here the definitions as given by Gapminder World. Literacy rate, adult total (% of people ages 15 and above): “Adult literacy is the percentage of people ages 15 and above who can, with understanding, read and write a short, simple statement on their everyday life” (Rosling, 2013). Ratio of girls to boys in primary and secondary education (%): “Ratio of girls to boys enrolled at primary and secondary levels in public and private schools” (Rosling, 2013). Since this ratio is of girls to boys, a value of 100 indicates equality between the two, that is, that for every boy enrolled in school, there is also a girl enrolled. Values less than 100 indicate that more boys are enrolled in school than girls, while values greater than 100 indicate that more girls are enrolled in school than boys. The United Nations Indicators for Monitoring the Millenium Development Goals includes both of these demographics.
Insights: Trends Revealed! Speculation Abounds!
Overall, it appears as though countries with high Literacy tend to have high Gender Parity, near 100, and low Literacy seems to go with lower levels of Gender parity. It is rare to see Gender parity and low Literacy or low Gender parity and high Literacy rates. This suggests the potential for some positive correlation between the two variables.
Another thing that becomes apparent is that both Literacy rate and Gender parity increase over time for all countries in the data set. There may be dips and regressions in between, but the end point is always further to the right than the starting point. There may not be a direct correlation between Adult Literacy and Ratio of Girls to Boys, there may be one or more factors that affect both of these demographics. One such factor could be an increased interest in Human Rights, or perhaps increased awareness of the benefits of literacy for all citizens. The United Nations considers youth literacy rate as “a proxy measure of social progress and academic achievement” (2.3 Literacy rate of 15 - 24 year-olds, women and men, 2012). Perhaps it is inevitable that all countries, over time, will have shown social progress and this affects these two variables, in turn.
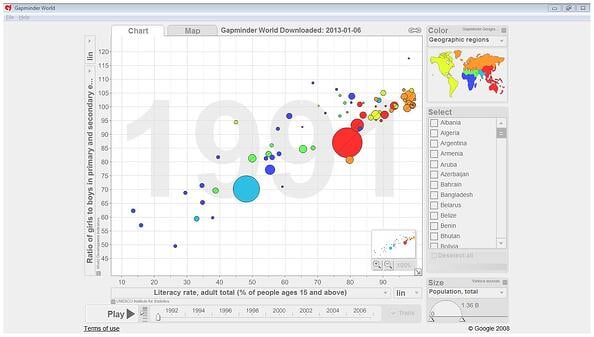
Figure 2: Gapminder Chart of Ratio of Girls to Boys in School vs. Adult Literacy Rate in 1991
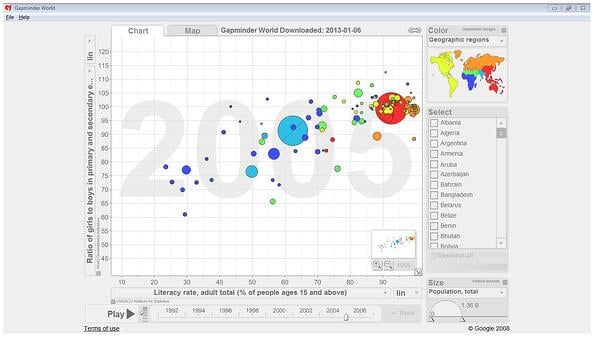
Figure 3: Gapminder Chart of Ratio of Girls to Boys in School vs. Adult Literacy Rate in 2005
A third observation concerns geography. The countries represented by blue, green, and teal circles are located in Sub-Saharan Africa, Middle East and North Africa, and South Asia, respectively. The countries represented by yellow, red, orange circles are located in the Americas, Europe & Central Asia, and East Asia & Pacific regions. The blue, green, and teal circles are almost entirely lower than the rest of the circles on both scales. What is it about African and Middle Eastern countries that would result in lower rates of Literacy and Gender parity than countries located in the Western Hemisphere, Europe, and Asia? Or is it coincidental?
Limitations, Pitfalls: Beware of Dangerous Curves
The United Nations stresses that literacy rates are “the complement of illiteracy rate” (2.3 Literacy rate of 15 - 24 year-olds, women and men, 2012). That is to say that a person is considered either literate or illiterate, so the percent of the population that is considered literate is determined by subtracting the percent of the population that is illiterate from 100. However, there is a continuum of degrees of literacy. Two people may both be considered literate, but may not read at the same level of comprehension. Furthermore, the United Nations also warns researchers to take care when “interpreting trends towards gender parity” because there is no way to know why the numbers appear to have improved (3.1 Ratios of girls to boys in primary, secondary, and teritary education, 2012). It could be that more girls are going to school, or that fewer boys are enrolling in school. These scenarios are not equivalent, but would have the same effect on the Gender parity score.
In the end, the chart extends an invitation to explore further, to learn more about the countries individually and together, in order to understand the reasons behind the changes in demographics over the years. We can hypothesize the potential connections and myriad reasons why, but only with further research will we be able to truly understand the connection between Ratio of girls to boys in school and Literacy rate, adult total.

References
Hillman, D. (Director). (2010). The Joy of Stats [Motion Picture]. Retrieved from http://www.gapminder.org/videos
Rosling, H. (2013, January). Gapminder World. Retrieved from Gapminder: Unveiling the beauty of statistics for a fact based world view: http://www.gapminder.org
United Nations. (2012, March 5). 2.3 Literacy rate of 15 - 24 year-olds, women and men. Retrieved from Indicators for Monitoring the Millenium Development Goals: http://mdgs.un.org/unsd/mi/wiki/2-3-Literacy-rate-of-15-24-year-olds-women-and-men.ashx
United Nations. (2012, Mar 5). 3.1 Ratios of girls to boys in primary, secondary, and teritary education. Retrieved from Indicators for Monitoring the Millenium Development Goals: http://mdgs.un.org/unsd/mi/wiki/3-1-Ratios-of-girls-to-boys-in-primary-secondary-and-tertiary-education.ashx


